Want to turn your product data into gold? Learn how to understand your users,...

Do you know where the secret sauce of a successful business lies? It lies in exceptional user experience. How users interact with your products speaks a lot about your performance and overall business growth.
Teams using product usage analytics have more chances of success than those who don’t know about their product usage. This is because identifying customers’ pain points and analyzing their behavior has become an absolute necessity in today’s over competitive digital market.
But the question is, how do you analyze a user’s response towards your product? Let’s find out the answer in detail below.
Remember the traditional ways in which surveys and interviews were performed to track how users engage with your products? These conventional methods can offer insights into users' preferences but are ineffective in providing a complete picture.
That’s where the latest tactics of product usage analytics come into play. These analytics help you get a detailed overview of customer data, usage patterns, and how they like your product on a scale of 1 to 10. Here are some key factors included in product analytics:
Besides, these usage analytics also include the churn rate to measure how many users return to the product and how many of them stop using it. Understanding the customer churn rate is a crucial factor because getting new customers costs four to five times more than retaining existing ones.
Product usage analytics are not all about user engagement and understanding their pain points. It goes beyond just analyzing friction points and offers endless benefits for product managers or teams. Let’s discuss some of the advantages in detail below:
Improve Customer Experience
User experience is the backbone of a successful business. With product usage metrics, you’ll get to know if users are satisfied with your products. This customer satisfaction will eventually lead to a better customer experience and more users returning back to your services. Overall, it’s a win-win situation for both customers and businesses.
Drive Product Development
One of the amazing benefits of product usage analytics is they help you make the much-needed changes in your products. When you know what type of products are loved by the customers, it’ll help you upgrade the services according to specific user preferences. For instance, you can do the following product changes:
All these products will help in successful product development and assist companies make data-driven decisions. Research has shown that even minor product changes can significantly improve user satisfaction rates to a greater extent.
Increase Overall Revenue
When companies get detailed analytics on what their customers like and what they dislike, it helps them adopt the relevant marketing tactics. For instance, when you know a certain product is being loved by a customer, you can create more products in that category. This way, you can generate more profitable products and increase sales by improving the usage experience.
Product usage analytics are unquestionably an indispensable tool for improving customer experience. These can help you collect, analyze, and work on user data to achieve the best business results. However, the real challenge is implementing these analytics. Relax, here is a step-by-step guide to help you in the implementation process:
Start by defining what you want to achieve with software usage analytics. The goals include improving user engagement, reducing customer churn rate and measuring DAU(Daily Active Users) or MAU(Monthly Active Users). You can set a target for each key performance indicator (KPI) and track results over time.
Here comes the most important step. When implementing product usage analytics, ensure you select the right analytics platform. Tools like Google Analytics and Aidbase can help you track customer usage patterns and modify changes over time.
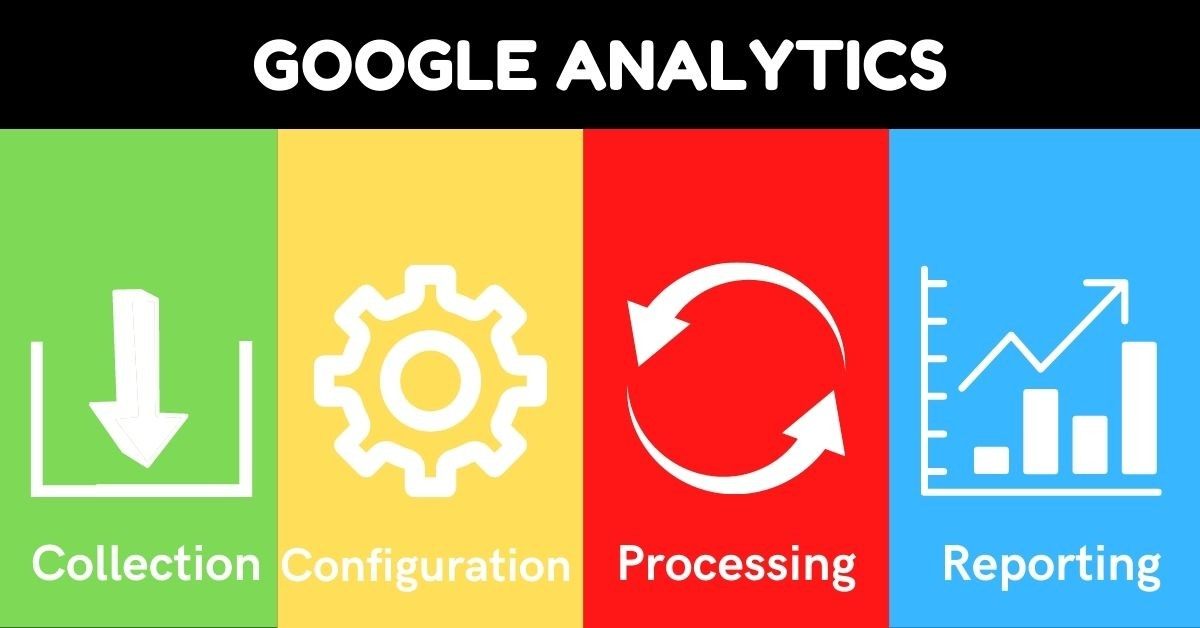
Now, it’s time to monitor user activity by collecting real-time data insights. Using the right analytics tool, users can store the necessary data points based on usage patterns and specific actions. For large amounts of data, you can use the batch processing method to collect and store user information.
Once you’ve collected a large amount of data, it’s time to analyze it. You can look for patterns or specific trends that need improvement to make better products. See specific actions that can lead to high conversion rates or drive more sales.
You can use different analysis methods, such as segmentation for product usage analytics. Segmentation can break down your users into various segments based on age, gender, or other demographics. This will help you determine what specific user actions lead to positive or negative outcomes.
The final step is to visualize data and use these insights to improve your product. This is called product experimentation in simple terms. For instance, companies can add a ‘’ABC’’ feature to see how users interact with the product. The following methods can be used for this purpose:
In each product usage analytics method, you can experiment with different product features or layouts to see what performs better regarding user engagement. It’s a simple and effective way to measure product success.
Product usage analytics is all about collecting data and tracking user insights. It uses different metrics and data points to analyze customer behavior about a specific product. Here are some examples of product analytics to get you a clear idea about the concept:
Number of Active Users
This includes the total number of active users who engage with your products. You can track the active users over specific periods. Generally, it involves the DAU (Daily Active Users) and MAU (Monthly Active Users) that stick with your products or services.
Engagement Metrics
Another example of product usage analytics includes user engagement metrics. In it, businesses can calculate the session duration, usage frequency, or number of clicks per session. These key user engagement metrics will help you identify how many users interact with your products over time.
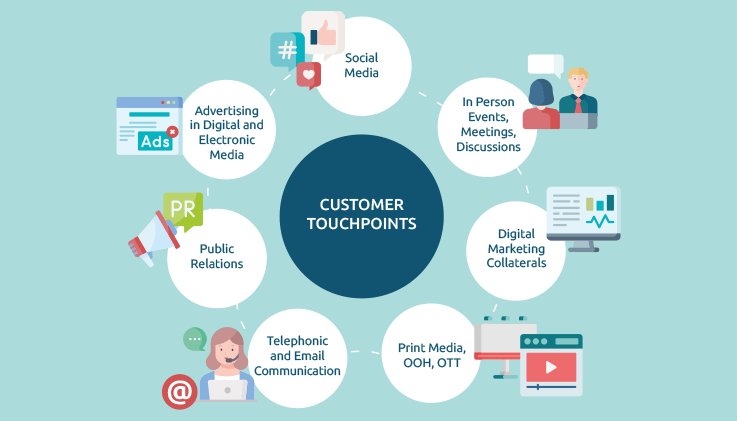
Customer Journey Mapping
Analyzing the drop-off areas or friction points is crucial in product usage. These customer journey touchpoints help improve user experience and make relevant changes within a specific timeframe. When you analyze what users dislike about your products, it will help you make better products and contribute to overall business growth.
Customer Churn Rate
When you know at which point users stop using your products, it will help you make informed decisions. Analyzing customer churn rates can help you better track progress and lead to overall user satisfaction rates.
Product usage analytics are not just an effective business strategy but a necessary tool to boost customer satisfaction rates. They can make or break your newly launched product and help you track user behavior. Implementing the right usage analytics will help you collect detailed insights and work on the services or products.
To track these analytics more effectively, Aidbase comes to your help. This AI chatbot customer experience tool helps you deliver better results and get an all-time support agent for your products. It's just like your personal assistant offering AI support and exceptional customer service at your fingertips. Sign up today to get the best AI customer service with Aidbase.
Tracking product usage is a key to understanding customer behavior and making informed data-driven decisions. You can track this usage by defining key metrics, using analytics tools and collecting data to improve your product.
Measuring product usage rate involves tracking how often customers interact with a product over a specific period. You can measure the key metrics, such as daily active users (DAU), monthly active users (MAU), session frequency, and average session duration. You can also use specific methods like segmentation to measure product usage rates.
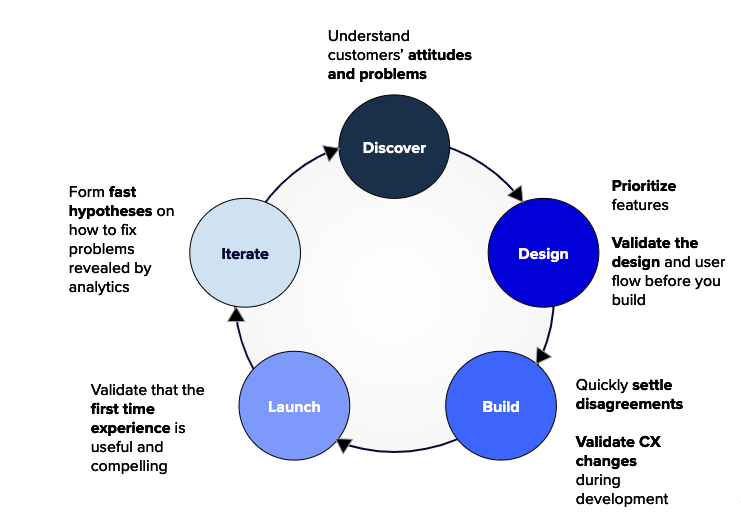
The product usage model outlines how a user interacts with a product. It includes the stages of engagement, such as initial discovery, regular use and long-term adoption. This model helps businesses understand customer behavior, identify key touchpoints, and optimize the user experience to meet their needs.
Improving feature adoption includes understanding how users interact with your features. You can set up analytics to monitor how often users engage with a particular feature. Another way is to combine quantitative data with qualitative insights by implementing user feedback through surveys or interviews. This will significantly improve feature adoption rates for your business.